
The Finale: 2012 KLX250S after mods DYNO CHART and VIDEO

Senior Member
1st Gear Member
Joined: Jun 2011
Posts: 1,135
From: San Francisco, CA
dyno on kustom kraft's website has the klx250 at a 16.58 hp...21.75 hp as a klx330...
http://kustom-kraft.com/files/KLX250...rt_6_22_11.pdf
http://kustom-kraft.com/files/KLX250...rt_6_22_11.pdf
Senior Member
Joined: Jul 2010
Posts: 1,414
From: Missouri
1st Gear Member
dyno on kustom kraft's website has the klx250 at a 16.58 hp...21.75 hp as a klx330...
http://kustom-kraft.com/files/KLX250...rt_6_22_11.pdf
http://kustom-kraft.com/files/KLX250...rt_6_22_11.pdf
Senior Member
1st Gear Member
Joined: Jun 2011
Posts: 1,135
From: San Francisco, CA
this was posted before with just 351cc kit..
With big-bore kit: 24.58 hp and 18.75 ft-lbs
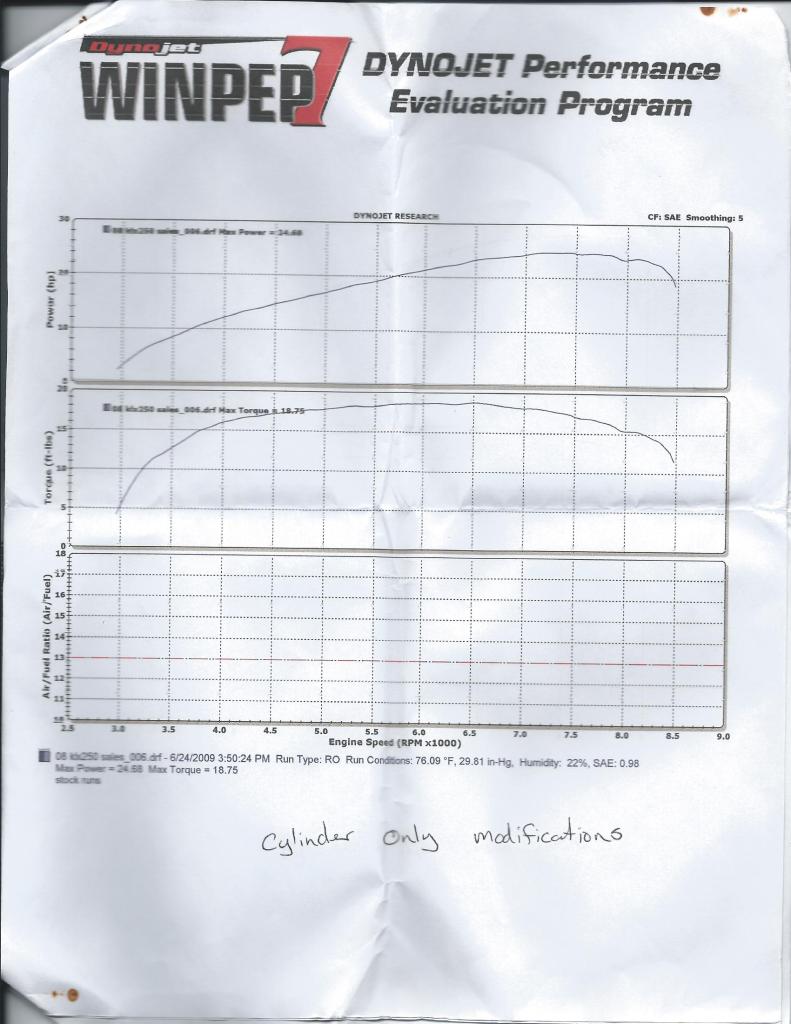
With big-bore kit: 24.58 hp and 18.75 ft-lbs

Thread Starter
|
Senior Member
Joined: Jun 2013
Posts: 3,315
From: North Texas
1st Gear Member
Ahnh666 's charts are complete and look valid.
SAE correction was used - see "CF: SAE" in the upper right corner.
The correction factors are shown in the lower right corner - on the 351 it was "SAE: 0.98" and the other was "SAE: 0.99" .... So, on that day, the 351's uncorrected HP was multiplied by .98 to get its corrected HP.
Just as important, both charts show the runs as roll-on - "Run Type: RO" ....
Smoothing of 5 is not part of the measurements. It just smooth's the graph.
My charts' atmospheric conditions and correction factor are on the top of page 2 and I did not post page 2. My bad. But the top right corner shows SAE correction was used and it was a roll-on run.
That being said, any chart that does not show this information is suspect, to put it nicely.
Last edited by Klxster; Jan 29, 2014 at 07:17 AM.
Thread Starter
|
Senior Member
Joined: Jun 2013
Posts: 3,315
From: North Texas
1st Gear Member
Dynojet charts are meant to be comparable from one to another as long as the parameters of the run are the same - namely the run type, correction factor and tranny gear used. If the dynos' are calibrated well and the software is using the same SAE revisions, and, in our case, the runs used 4th gear, and they were honest runs without tricks to inflate the numbers, they should be comparable.
The KK chart is hard to dismiss. They sell BB kits and would not inflate the HP of the stock bike. It's from 2011 but I don't know what model year KLX was run. I am surprised to see that much HP (16.58)....
None-the-less, it puts my forum modded KLX at almost a %20 increase in HP and a %27 increase in torque over that charts' stock KLX.
Last edited by Klxster; Jan 30, 2014 at 07:49 PM.
Senior Member
1st Gear Member
Joined: Mar 2013
Posts: 866
From: SE Asia
Dynojet charts are meant to be comparable from one to another as long as the parameters of the run are the same - namely the run type, correction factor and tranny gear used. If the dynos' are calibrated well and the software is using the same SAE revisions, and, in our case, the runs used 4th gear, and they were honest runs without tricks to inflate the numbers, they should be comparable.
The KK chart is hard to dismiss. They sell BB kits and would not inflate the HP of the stock bike. It's from 2011 but I don't know what model year KLX was run. I am surprised to see that much HP (16.58)....
The KK chart is hard to dismiss. They sell BB kits and would not inflate the HP of the stock bike. It's from 2011 but I don't know what model year KLX was run. I am surprised to see that much HP (16.58)....
If other KLX dyno runs are in 5th and you are comparing with 4th gear runs you may be automatically a bit behind what others are seeing in 5th?
This YT video of a +32hp 351 with 101 webcams evidently tries both 4th and 5th gears

Thread Starter
|
Senior Member
Joined: Jun 2013
Posts: 3,315
From: North Texas
1st Gear Member
Found a good article here - Dyno Operators Can "Fix" Results | Super Streetbike
However, it doesn't talk about the effects of tire pressure on the curves.
The articles I'm reading seem to differ on the effects of the tranny gear used. One says a lower gear (e.g. 4th) will produce higher numbers - Another says 1:1 ( 5th) will produce higher numbers... They all agree on the basic premise that the tranny gear used will have an effect on the curves. So a comparison between DynoJet charts using SAE CF, Smoothing 5, etc. etc. will also need to be using the same tranny gear and the same type of test (e.g. Roll on)... If the parameters are the same, DynoJet charts are meant to be comparable....
Last edited by Klxster; Jun 28, 2014 at 02:40 AM.

Thread
Thread Starter
Forum
Replies
Last Post